
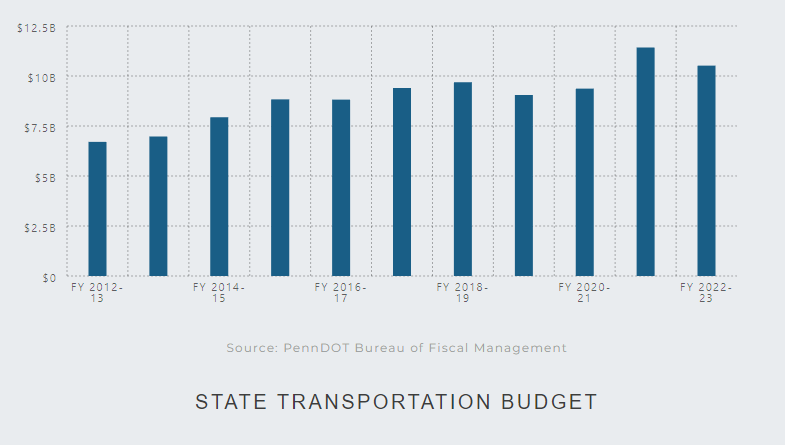
Annual Budget

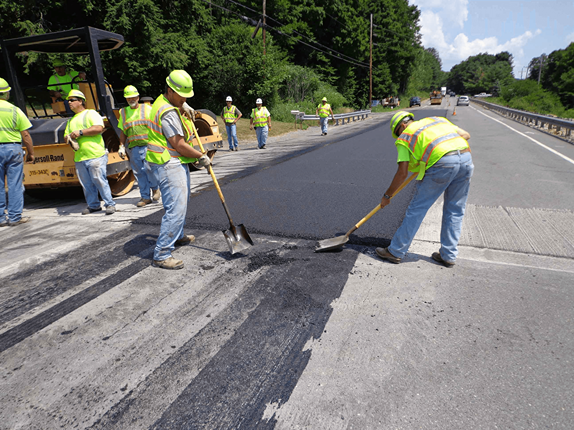
Miles of Roadway

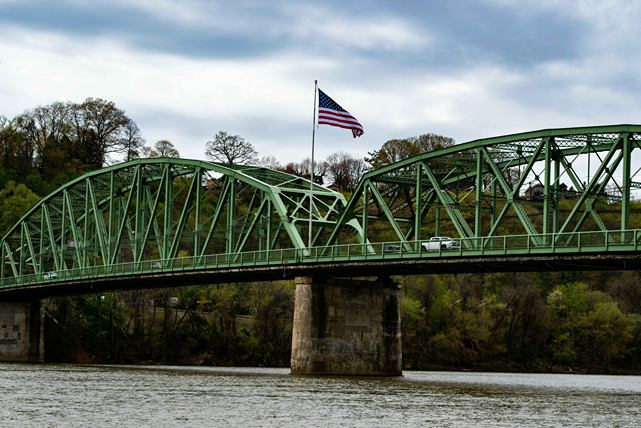
Bridges
Transit Systems

Operating Railroads

Licensed Drivers & ID Holders

Registered Vehicles

Annual Construction Contracts Bid in 2022

7,095 Maintenance Employees

Ports

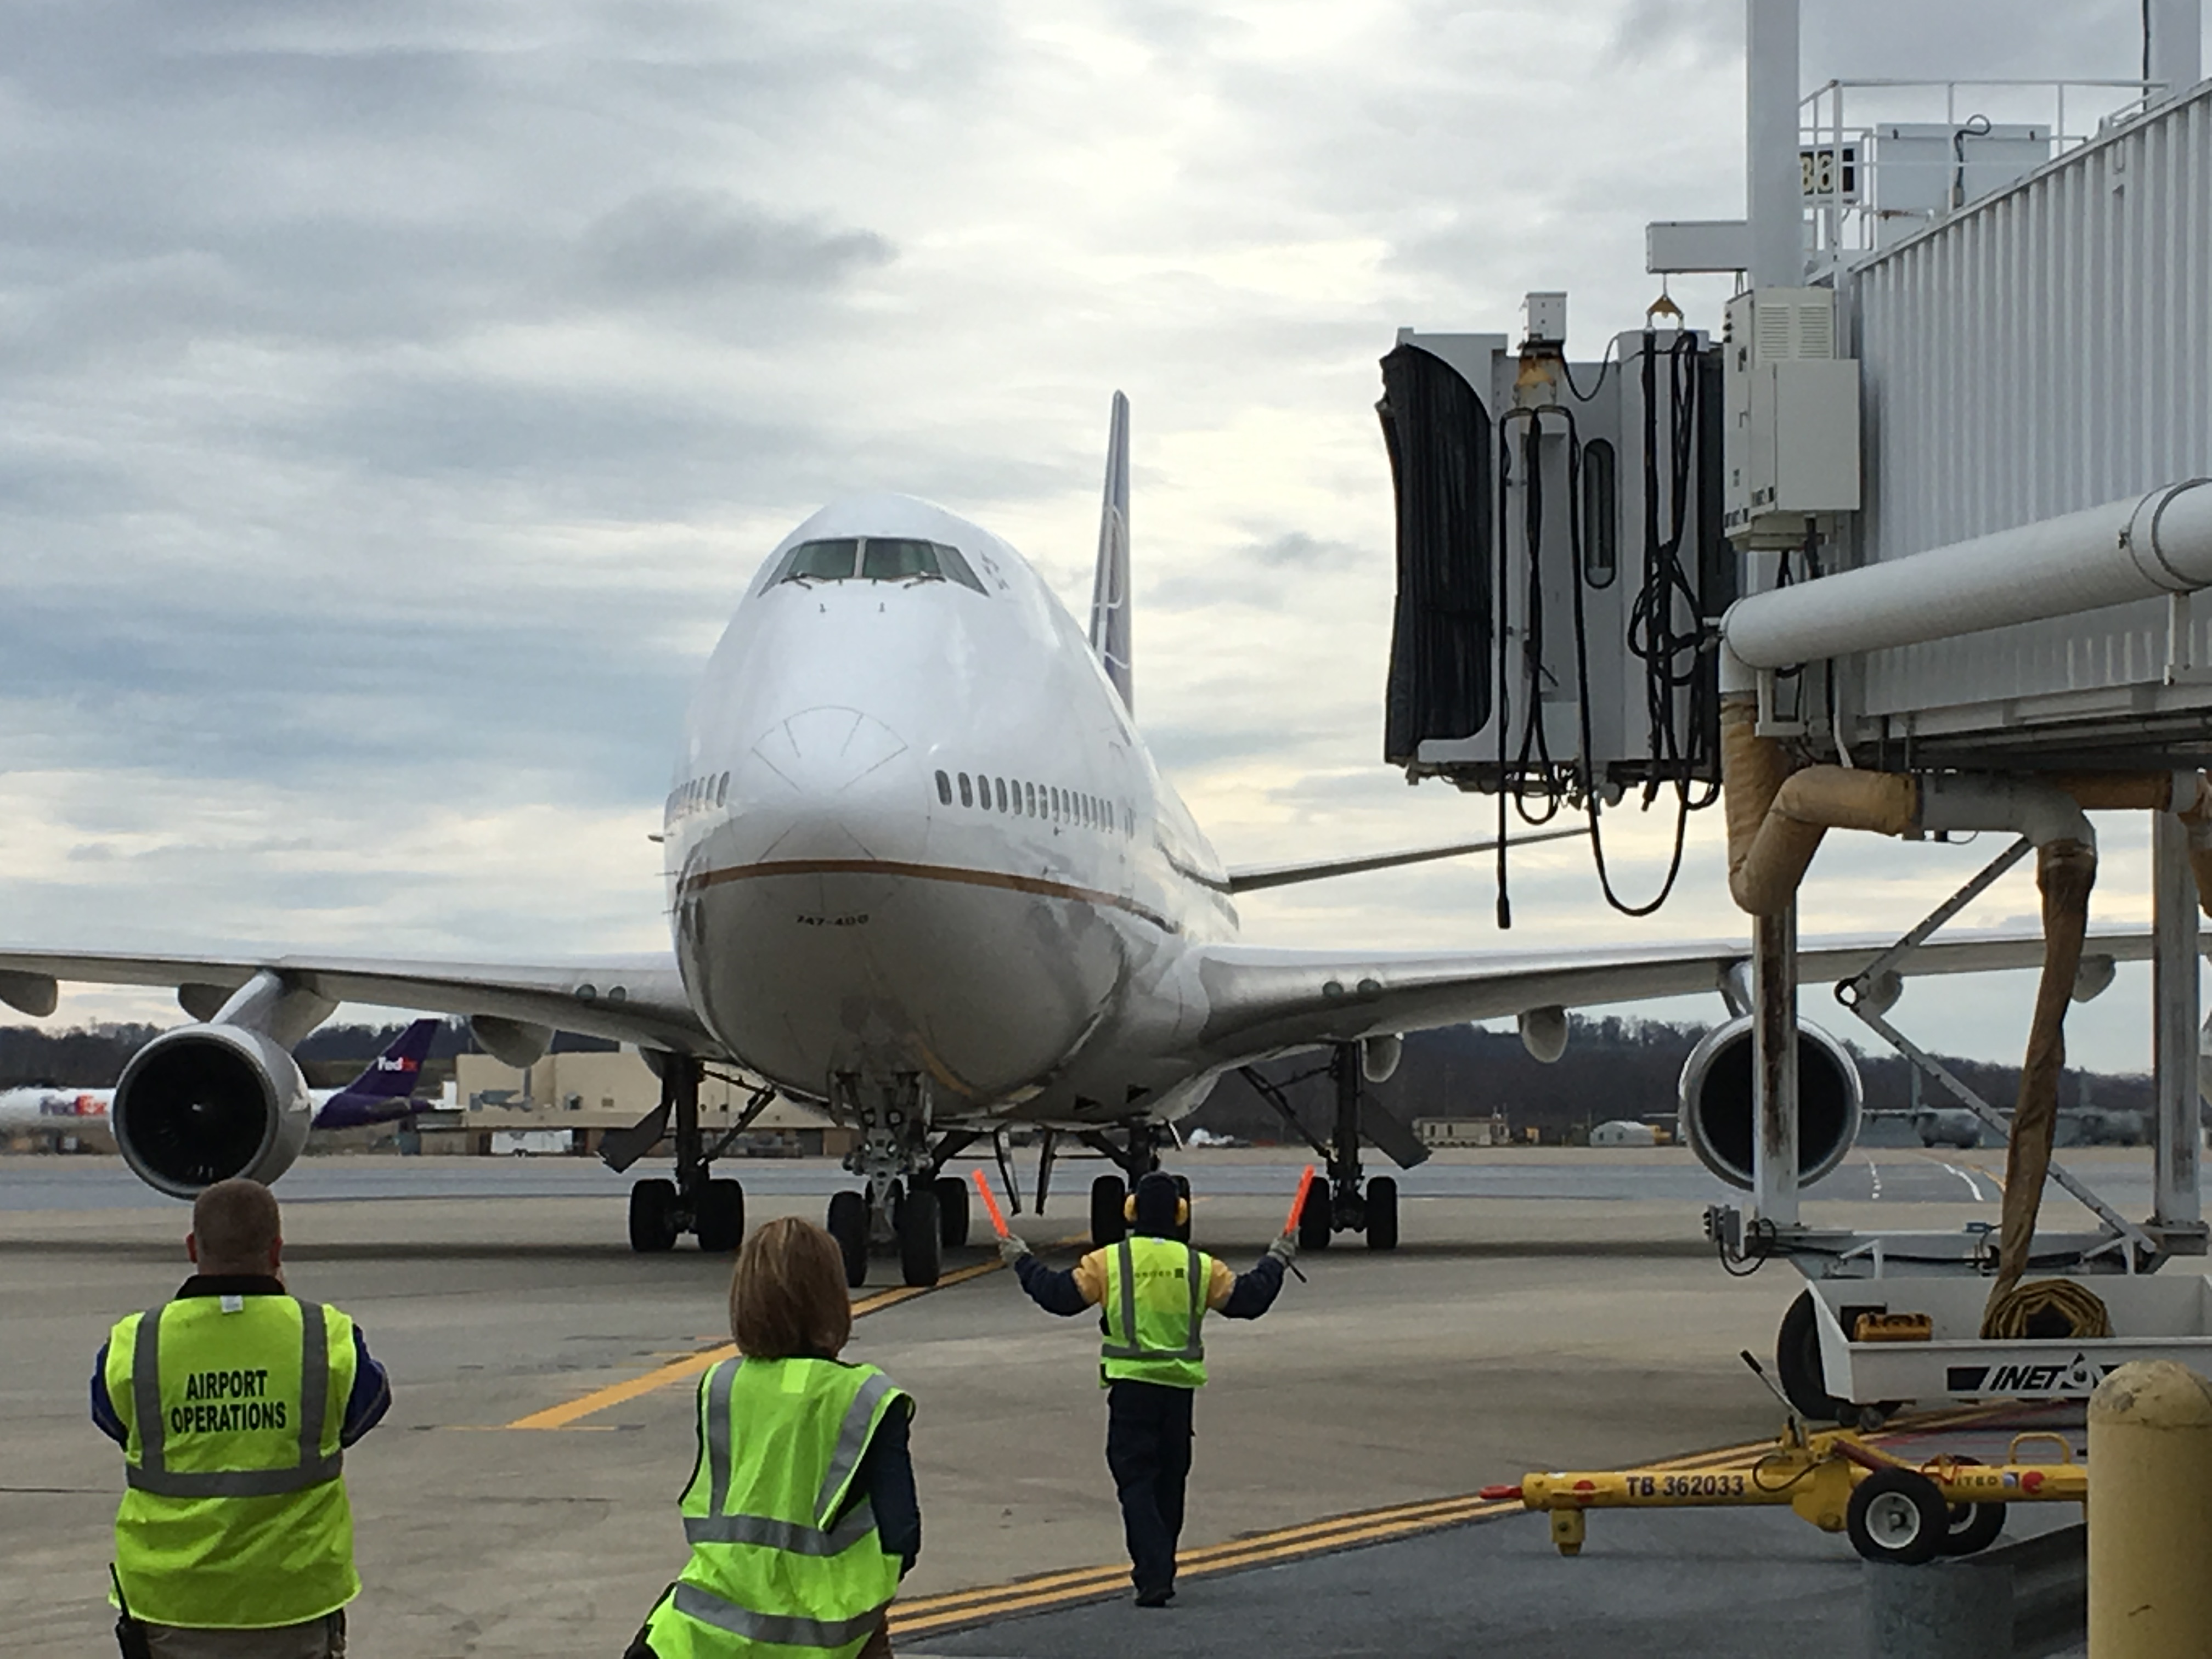
Public Use Airports

Annual Vehicle Miles Traveled*
*Total miles on all PA roadways.
Performance measures are organized into six categories: Safety, Mobility, Preservation, Accountability, Funding, and Freight. Click each performance measure to view details and explore the interactive charts. The table below explains the ratings icons.

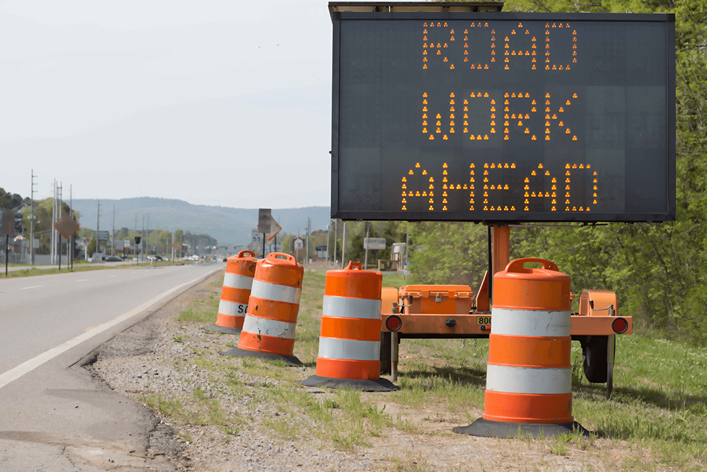
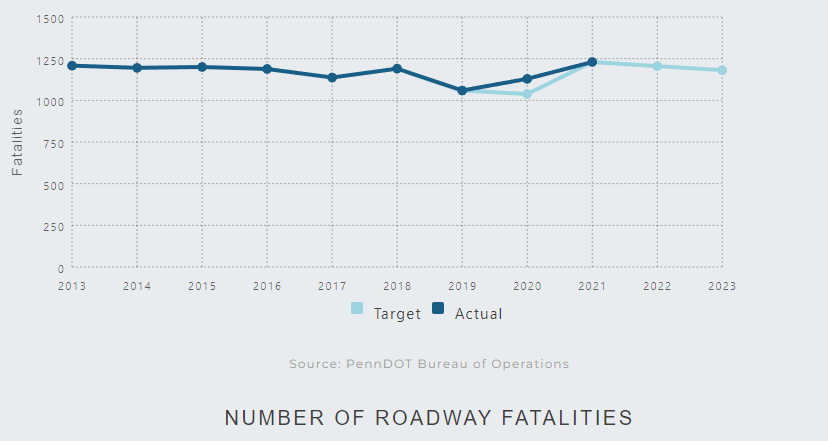
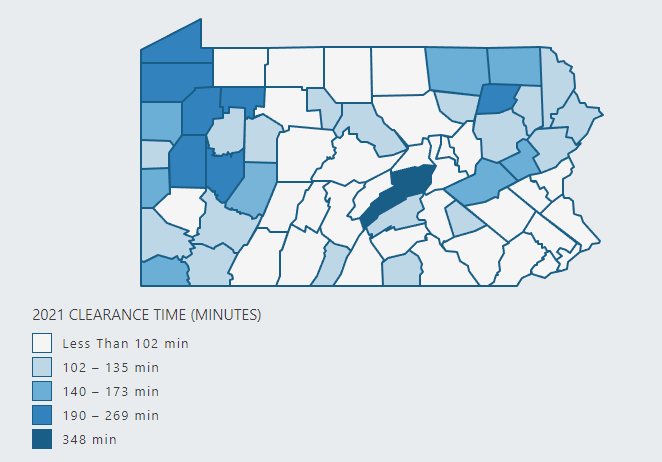
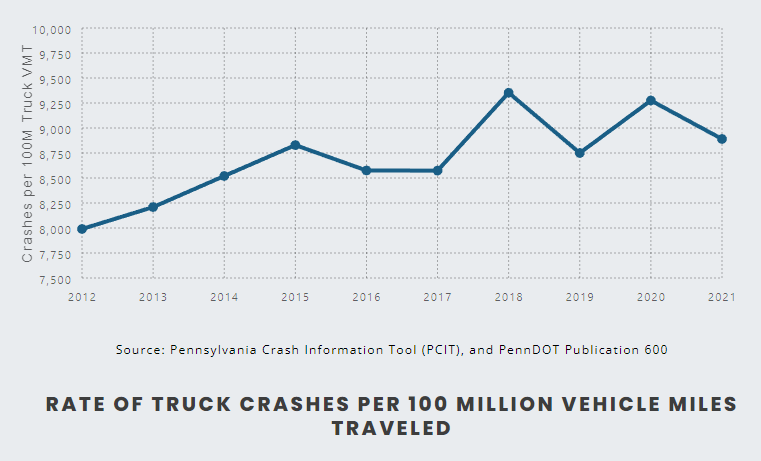
PennDOT takes a multi-faceted approach to improve safety statewide through initiatives like safety campaigns, behavioral programs, and infrastructure improvements. Since the pandemic, Pennsylvania has experienced an overall rise in roadway fatalities. The COVID-19 pandemic greatly impacted how typical road users traveled in 2020-2021 and may continue influencing trends in the future.
The 2022 Strategic Highway Safety Plan details the Commonwealth's blueprint to reduce fatal and serious injury crashes through 2027. The plan targets Priority Emphasis Areas and Safety Focus Areas that have the most influence on improving highway safety statewide.
Pennsylvania recorded 1,230 roadway crash fatalities in 2021, the highest total in nine years. Annual crash fatality totals have been rising since the record-breaking year of 2019, when an all-time low of 1,059 was recorded. The two consecutive years of increased roadway crash fatalities are the first since 2002.
The Pennsylvania legislature amended the state's Vehicle Code through Act 86 of 2018, which introduced automated speed enforcement in Pennsylvania's work zones and on a portion of Roosevelt Boulevard in the City of Philadelphia through a 5-year pilot program. The state Transportation Advisory Committee evaluated the Roosevelt Boulevard pilot in 2022 and recommended the program's continuation and statewide expansion after the law's December 2023 sunset.


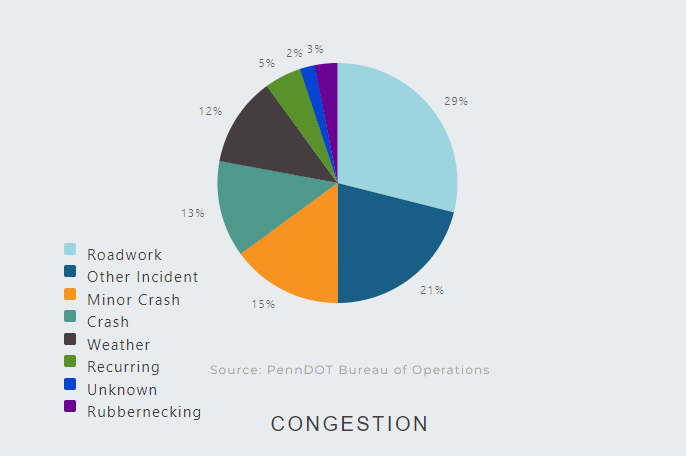
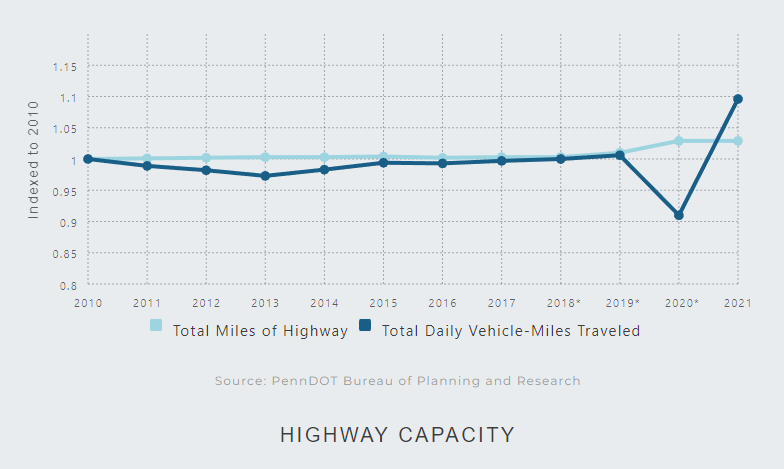
Pennsylvania's mobility is provided primarily by its nearly 121,000-mile network of roadways that support over 281 million miles of travel daily. As a multimodal transportation agency, PennDOT manages a range of programs from highways, bridges, aviation, water ports, public transportation, rail freight, passenger rail, and active transportation that facilitate the movement of people and goods.
PennDOT supports key technology advancements through initiatives like the National Electric Vehicle Infrastructure (NEVI) plan to build electric charging infrastructure. The formula program will provide more than $171 million to the state through 2026.
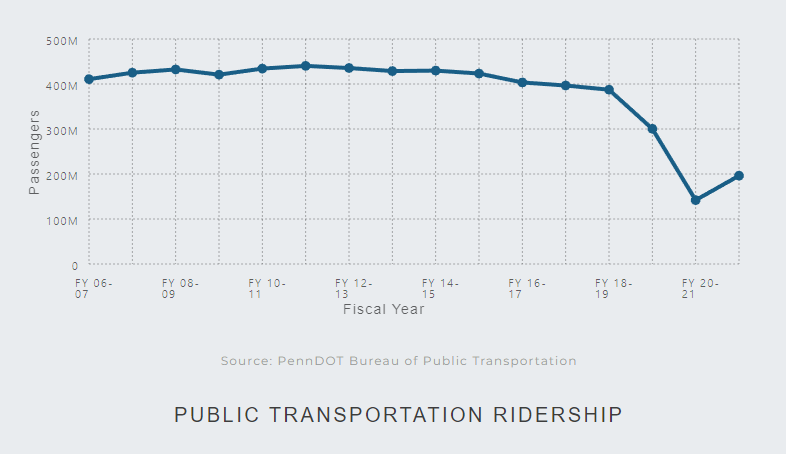
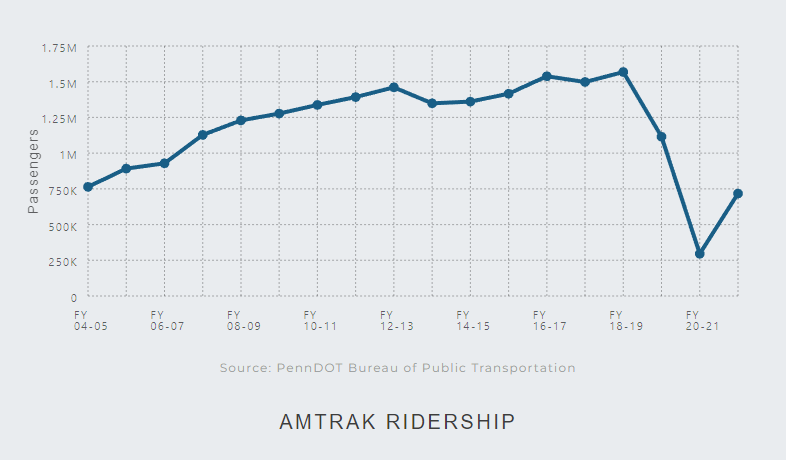
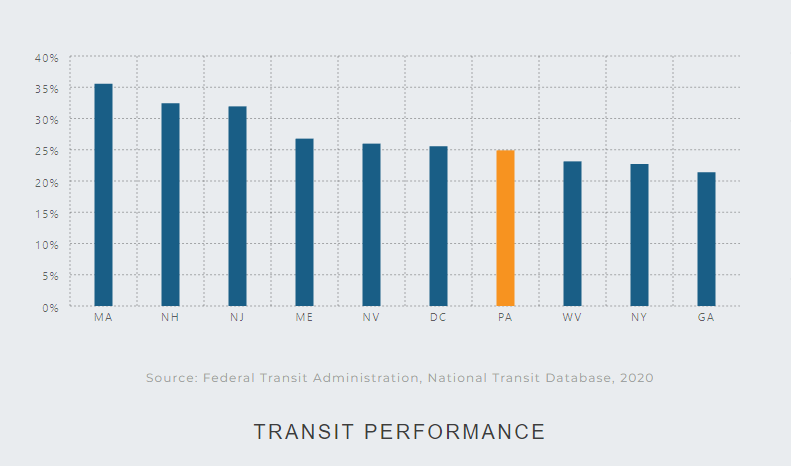
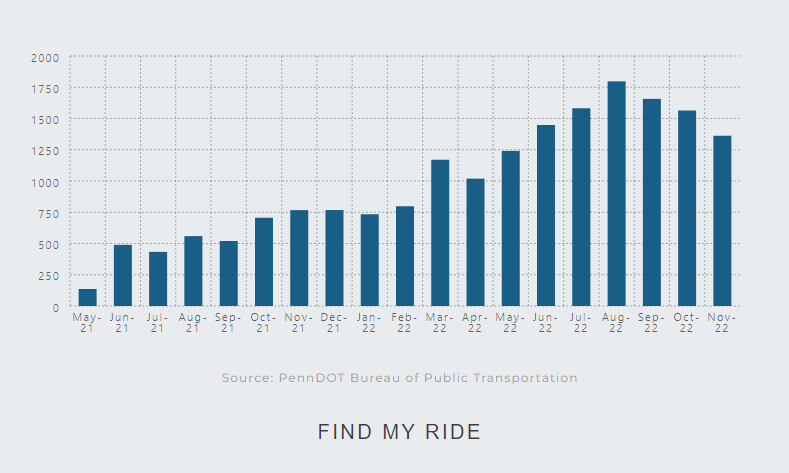
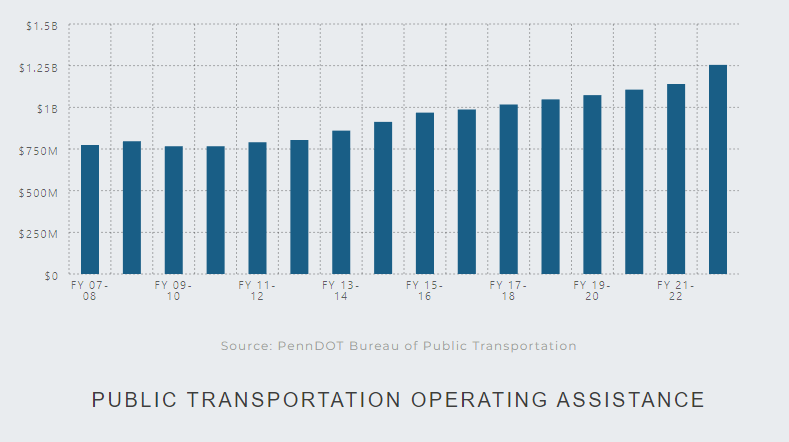
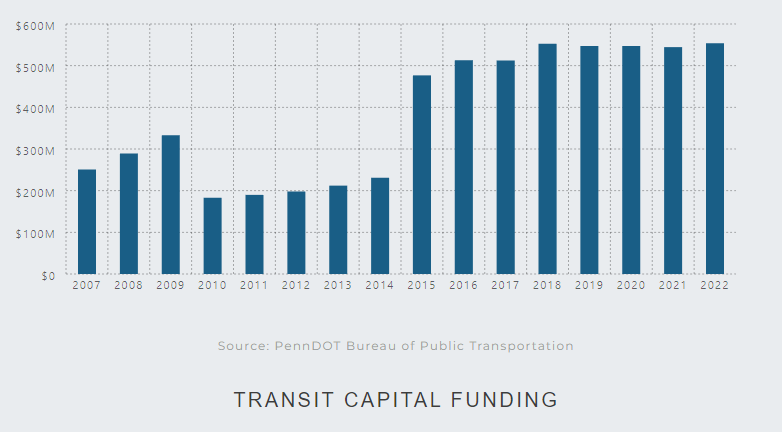
PennDOT faces ongoing challenges with a post-pandemic decline in transit ridership. While ridership is recovering, it still lags pre-pandemic volumes. The Department has provided additional funding to systems and is in the process of distributing a second round of funding for those still in need.
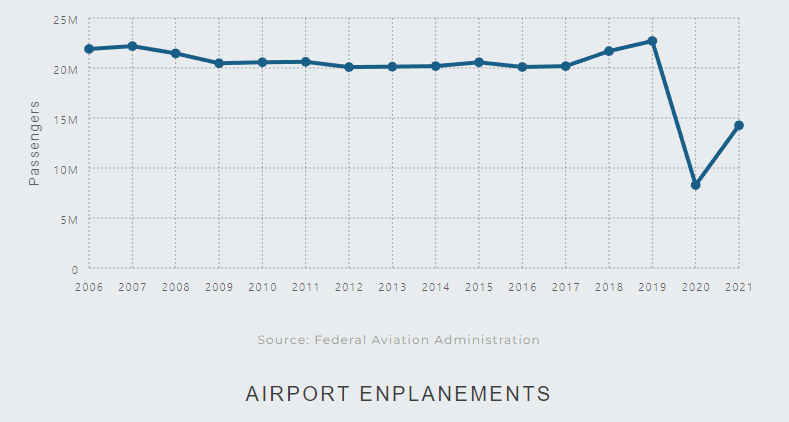
A 2022 study by the state Transportation Advisory Committee identified an annual state funding gap of $53.5 million for Pennsylvania's aviation system. The funding shortfall means that airports must defer projects, resulting in a state aviation system that is less competitive and poorly positioned for future growth.
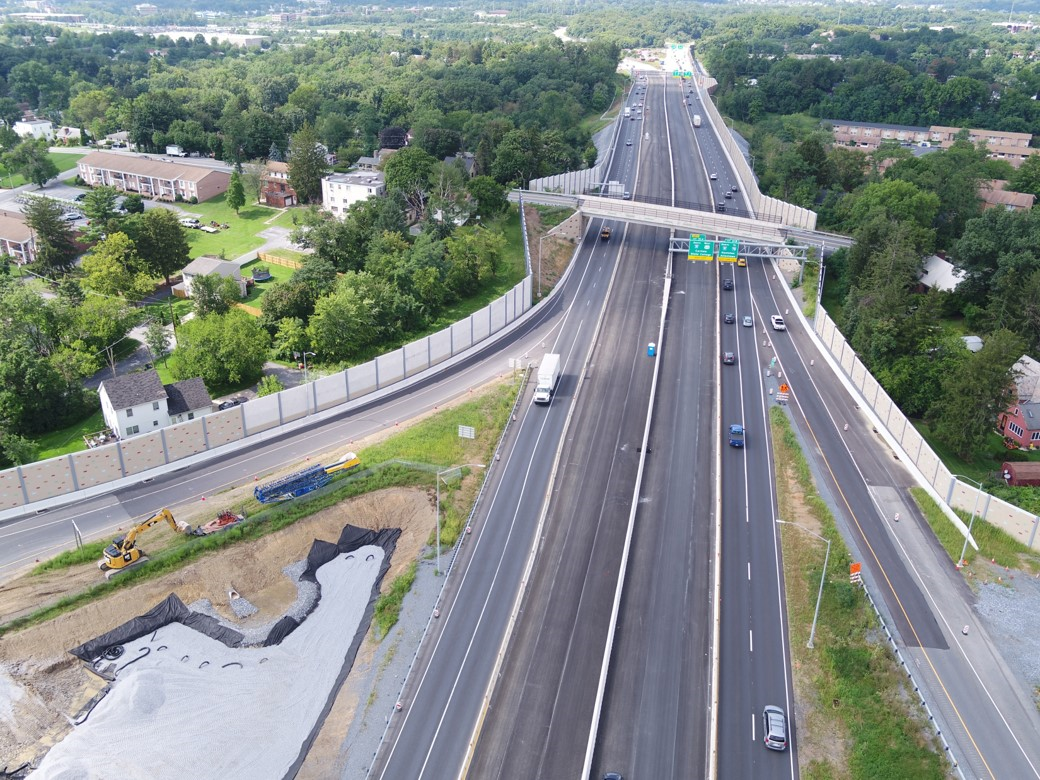


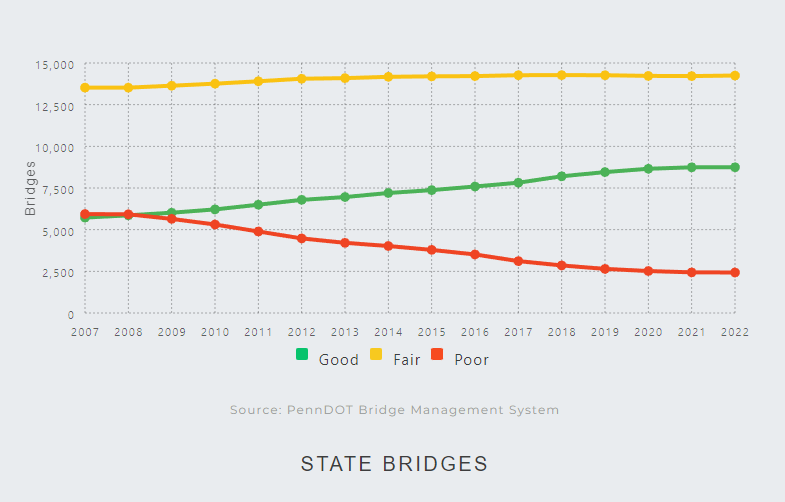
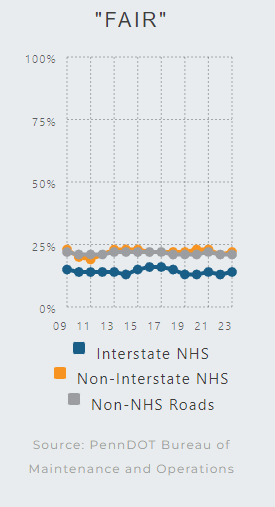
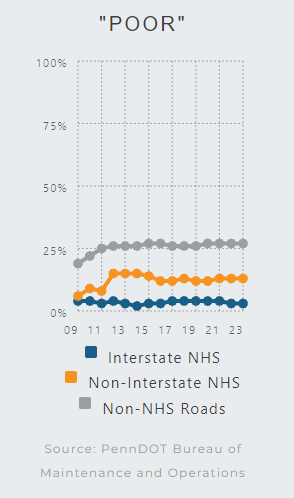
Pennsylvania's transportation network requires effective resource management to upgrade and maintain. One of PennDOT's primary challenges is preserving and maintaining its assets at the lowest practical life cycle cost. Lowest Life Cycle Cost (LLCC) project selection strategies (promoting the proper treatment at the right time) will help PennDOT better manage assets and program budgets to create longer-lasting infrastructure.
PennDOT continues to work with its network of MPOs and RPOs to evolve project selection processes for future long-range transportation plans and Transportation Improvement Programs. This includes introducing more information on equity and the environment as project selection criteria, and more public engagement earlier in the planning process.
Planning work and federal environmental reviews have resumed for six bridge replacement projects proposed as part of the Major Bridge Public-Private Partnership (MBP3). PennDOT’s P3 partners will design, build and maintain the bridges.
The American Society of Civil Engineers (ASCE) in its 2022 Report Card on Pennsylvania's Infrastructure gave the state a grade of “C-” – the same as the 2018 report card. While there has been progress, challenges remain, particularly with inflation and resiliency to climate change.


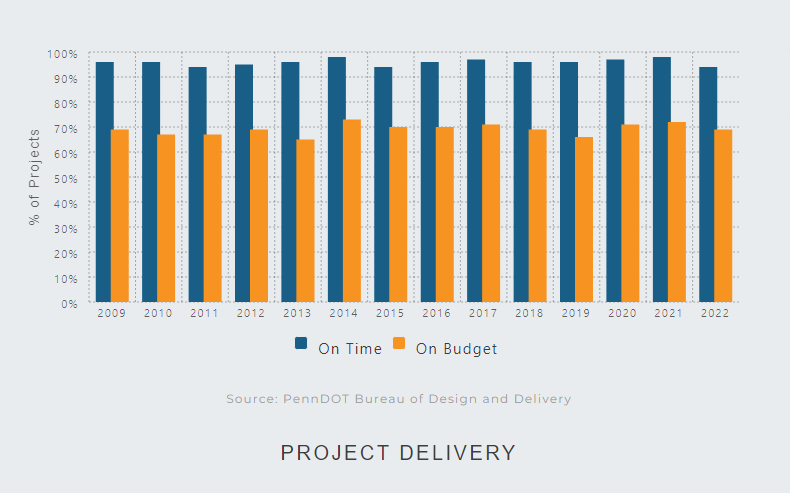
Transparency and accountability are top priorities for PennDOT. The Commonwealth, in May 2022, launched the Mentor Protégé Program, which will enhance the ability of Small Diverse Businesses (SDBs) to compete for Commonwealth non-highway capital construction and supplies and services procurement opportunities. PennDOT hosted a one-day, “Pathways to PennDOT” conference in 2022 to connect Disadvantaged Business Enterprises (DBEs) to the resources and opportunities at PennDOT that can help their firms grow.

The passage of the Federal Bipartisan Infrastructure Law in November 2021 injected $11.3 billion for federal aid, highway apportioned programs, and $1.6 billion for bridge replacement and repairs in Pennsylvania through 2026. The new law also includes new discretionary grant programs for critical infrastructure and programming statewide like bridges, electric vehicles, safety programs, and reconnecting communities.
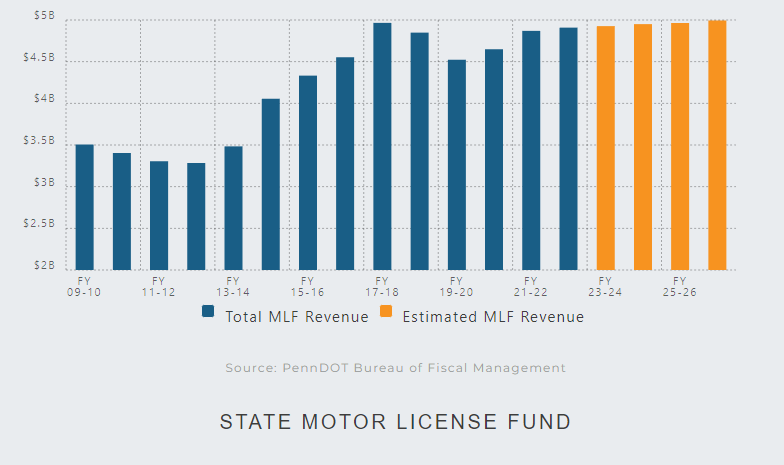
Several years ago, recognizing transportation system investment needs exceed current funding, PennDOT began exploring new funding options, including reviewing possible road user fee strategies and other alternative means of funding that have been emerging across the nation. PennDOT Pathways was established to identify, assess, and implement reliable, equitable alternative funding solutions for Pennsylvania’s vast range of multimodal transportation system needs.
In March 2021, this commission was established to develop a comprehensive strategic proposal for addressing Pennsylvania's transportation funding needs, now and into the future. View the Transportation Revenue Options Commission 2021 Final Report and Strategic Funding Proposal (PDF).
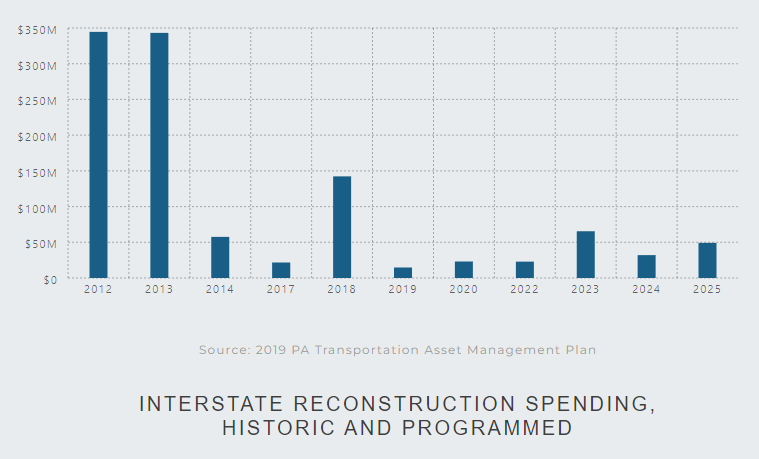
Currently, PennDOT invests between $450 and $500 million per year on the Interstate Highway System. The annual amount needed to meet cyclical asset management requirements is $1.2 billion.

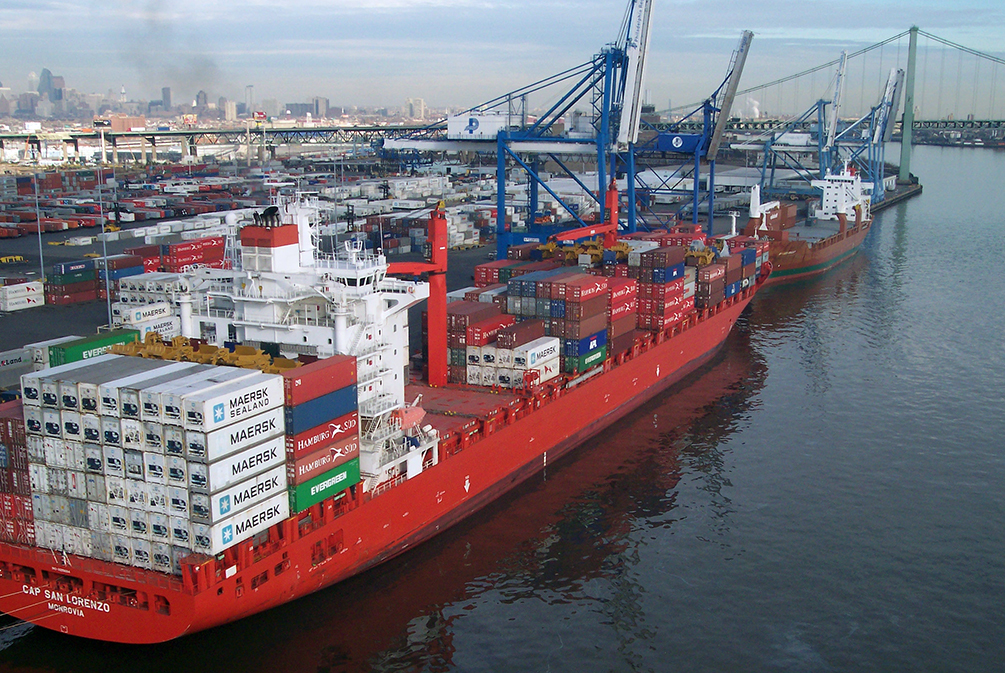
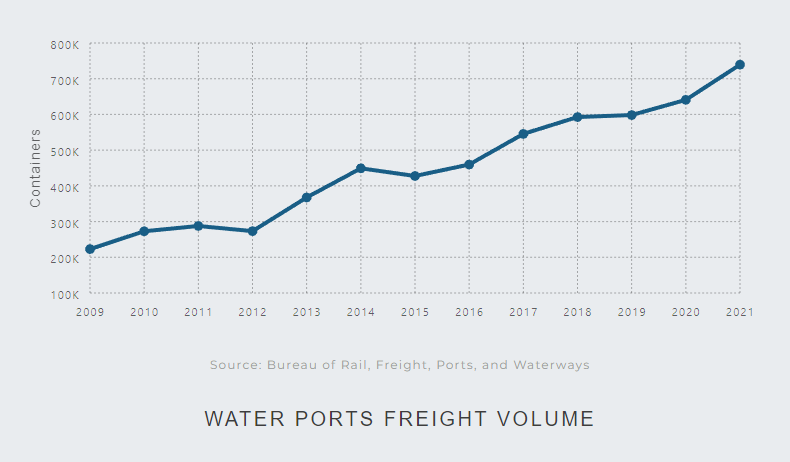
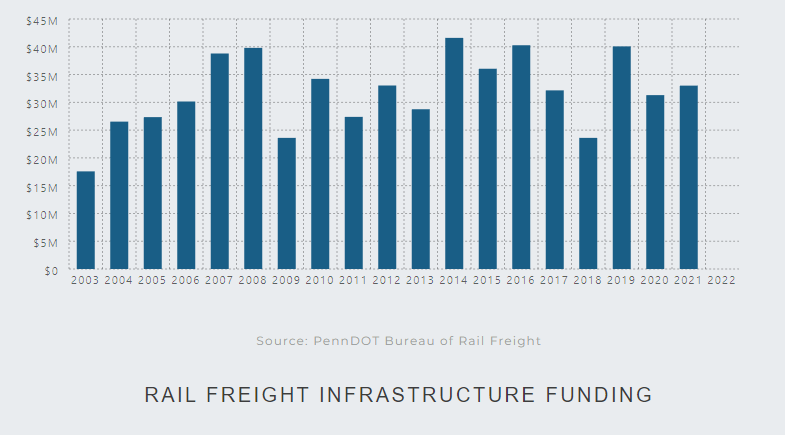
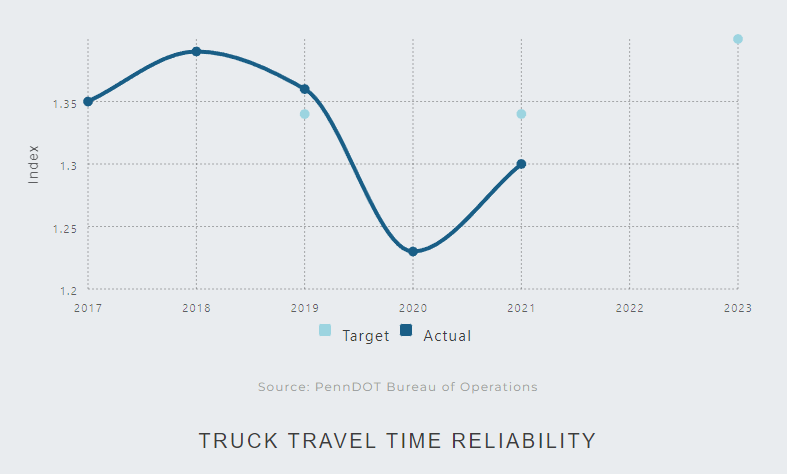
PennDOT updated the state's Freight Movement Plan in 2022 using a process that included a virtual statewide freight forum, engagement with the state's MPOs and RPOs, and freight stakeholders. FHWA approved the plan in December 2022, and plan implementation is already underway. The plan makes Pennsylvania eligible for $58.5 million annually in federal freight funding from the National Highway Freight Program.
PennDOT has organized a Freight Work Group to serve in support of the agency's freight planning activities, including the implementation of and future updates to the Freight Movement Plan.
Freight planning must constantly respond to natural and other disruptions like COVID-19 and strikes, respectively that fracture international trade. Moreover, freight planners must be aware of changing consumer demands such as BOPUS (buy online, pick up in-store) and the implications of evolving technologies.

PA Department of Transportation:
RA-PennDOTSTC@pa.gov
February 2023
©State Transportation Commission
Commonwealth of Pennsylvania
Accessibility
Privacy & Disclaimers
© 2023 Pennsylvania Transportation Performance Report
Developed by Michael Baker International