

WELCOME TO THE 2021
TRANSPORTATION PERFORMANCE REPORT
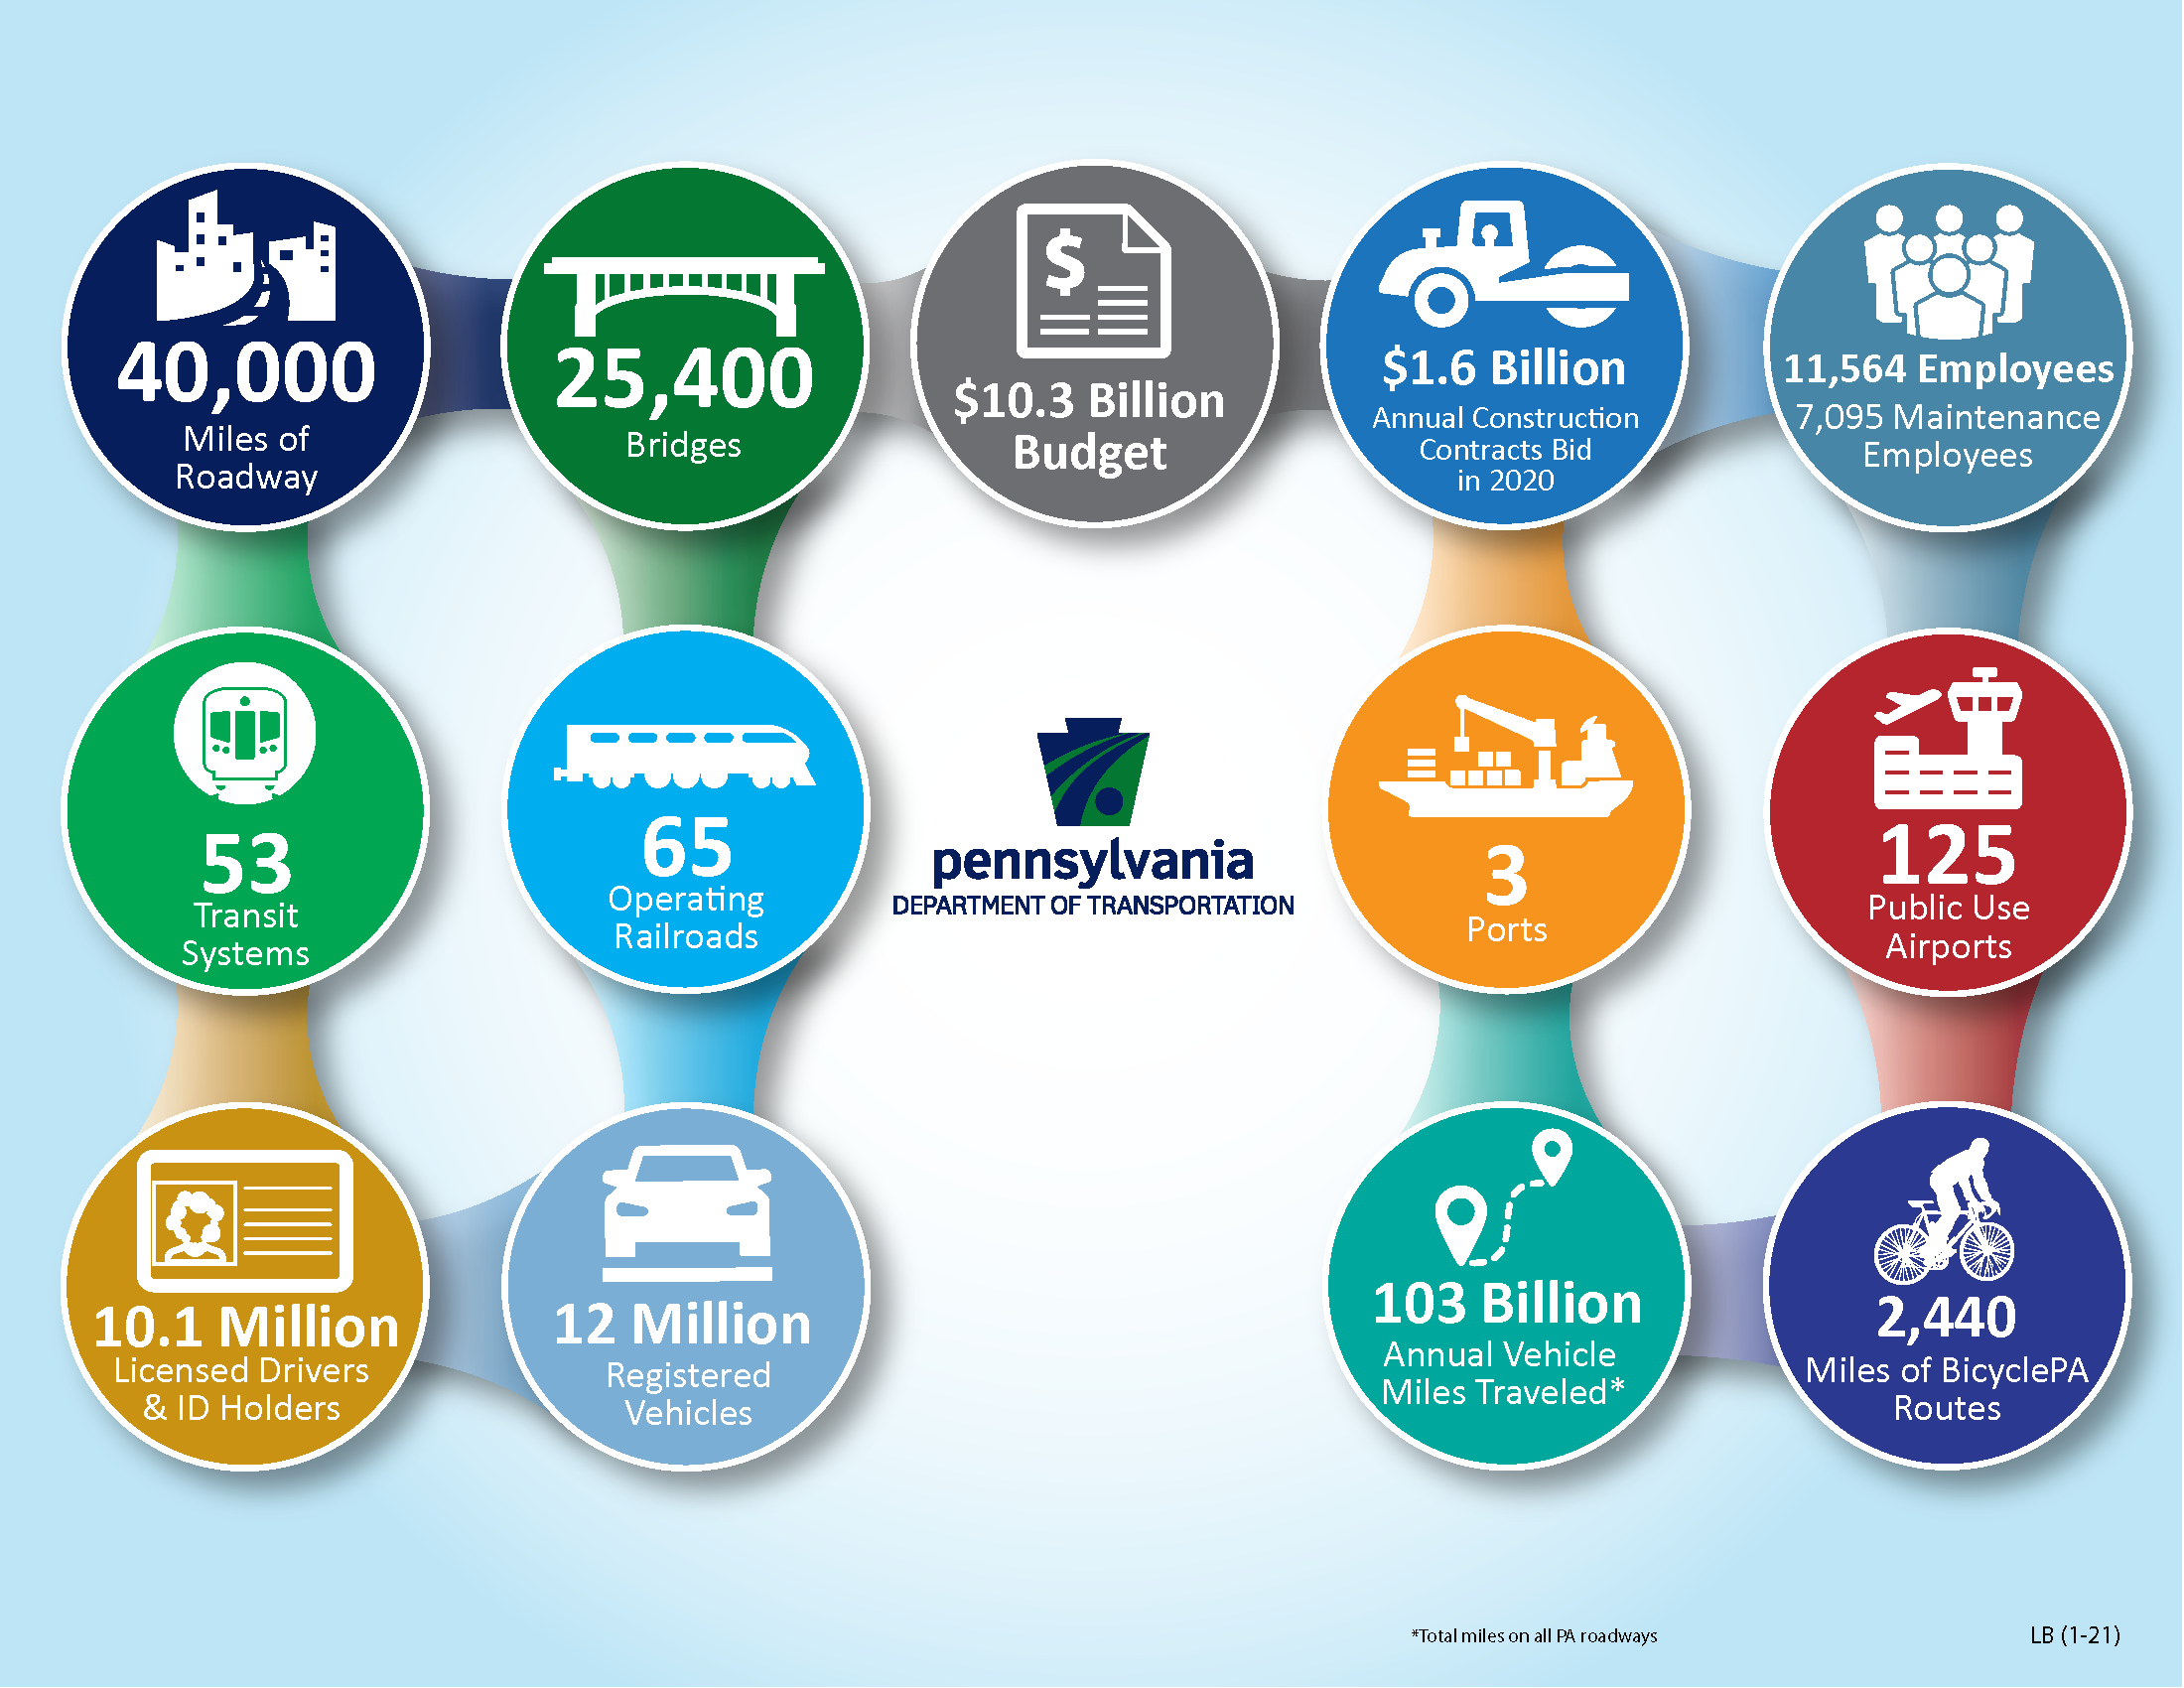
Pennsylvania by the Numbers
February 2021

$10.3 Billion
Budget

40,000
Miles of Roadway

25,400
Bridges
53
Transit Systems

65
Operating Railroads

10.1 Million
Licensed Drivers & ID Holders

12 Million
Registered Vehicles

$1.6 Billion
Annual Construction Contracts Bid in 2020

11,564 Employees
7,095 Maintenance Employees

3
Ports

125
Public Use Airports

103 Billion
Annual Vehicle Miles Traveled
(Total miles on all PA roadways)

2,440
Miles of BicyclePA Routes
Pennsylvania Transportation Planning Process

Navigating Our Performance and Trends
Performance measures are organized into five categories: Safety, Mobility, Preservation, Accountability, and Funding. Click each performance measure to view details and explore the interactive charts. The table below explains the ratings icons.
Performance Summary
SAFETY
Reducing Fatalities and Injuries
Safety is the highest transportation priority for Pennsylvania. After a slight uptick in 2018, highway fatalities in Pennsylvania were down to an all-time low in 2019, but significant work remains for PennDOT and its partners. Pennsylvania’s Strategic Highway Safety Plan describes strategies and initiatives to support safe travel for residents, visitors, and businesses.
Crash fatalities down
The number of roadway crash fatalities in Pennsylvania continues to decline. In 2019 there were 1,059 crash fatalities, the lowest in recorded history. PennDOT continues to use a data-driven approach to applying a diversified mix of safety measures to further encourage an improvement in these numbers.
Improving work zone safety
In 2019 Pennsylvania matched an all-time low in the number of work zone crashes, reversing a three-year trend. A new state law (Act 86 of 2018) now allows automated speed enforcement cameras in work zones on certain Pennsylvania highways including the Turnpike and interstate highways.
Safety Measures
Number of Roadway Fatalities 
- In 2019 there were 1,059 fatalities in crashes, the lowest in recorded history. This met Pennsylvania’s annual performance measure target and represented the lowest in recorded history.
- Pennsylvania has continued to manage a very diversified safety program that encompasses infrastructure improvements, education and outreach as well as support for enforcement activities.
- Much of PennDOT’s success in improving safety in recent years is attributable to having a data-driven approach. Pennsylvania is considered a national leader in many areas and was one of the states in 2019 that experienced a high reduction in fatalities.
- 2019 Crash Facts and Statistics
- Pennsylvania Crash Information Tool
Bicyclist Fatalities
- The current trend for bicyclist fatalities has remained relatively stable.
- In 2020, a series of new videos was developed to further encourage bicycle safety. These videos can be found on the Bicycle Safety and Pennsylvania Laws website and have also been shared on social media platforms to further raise awareness.
Pedestrian Fatalities
- Total pedestrian fatality trends have remained somewhat constant. This is an emerging area of concern as the Department continues its efforts to support access to various transportation modes.
- PennDOT developed new social media graphics and a video in 2020 to further encourage pedestrian safety. This video can be found on the Pedestrian Safety website and has been shared on social media platforms.
Work Zone Crashes
- The number of work zone fatalities has fluctuated slightly but has remained relatively constant over the last decade.
- Work zone crashes have been an emphasized safety focus area in the Strategic Highway Safety Plan (SHSP) since 2006.
- Pennsylvania enacted a law in 2018 allowing an Automated Work Zone Speed Enforcement (AWZSE) program in the Commonwealth. The program was named as one of the top 12 projects nationwide in the America's Transportation Awards competition. PennDOT administers the AWZSE program collaboratively with the Pennsylvania Turnpike Commission.
Motorcyclist Fatalities
- Total motorcyclist fatalities have been trending in a favorable direction over the past decade.
- PennDOT continues to provide education and training to support and encourage motorcycle safety.
- DVS recently completed a PA Motorcycle Data Report which should aid in determining future counter measures to improve motorcyclist safety.
- Pennsylvania Motorcycle Safety Program
[NEW] Run Off the Road Fatalities
- Pennsylvania continues to experience positive trends for run off the road fatal crashes; however, it is still one of the larger factors in roadway fatalities. This topic drives many infrastructure countermeasures that PennDOT applies annually.
- Pennsylvania’s varied topography makes this issue difficult to address. The curvature of roadways due to rolling terrain and the proximity of fixed objects (trees, poles, etc.) to the roadways are frequent issues PennDOT must address when examining infrastructure improvements to improve safety.
- Safety Infrastructure Improvement Program
- Pennsylvania Roadway Departure Safety Implementation Plan (2012)
[NEW] Local Road Fatalities
- Local road fatalities have remained relatively constant over time. Additional coordination is often necessary in addressing safety on these roadways since the roads themselves often do not fall under PennDOT jurisdiction.
- The Strategic Highway Safety Plan has identified local safety as a focus area. Page 28 of this document specifically lists the strategies Pennsylvania has been working on to enhance safety on Local Roads.
MOBILITY
Moving People and Goods
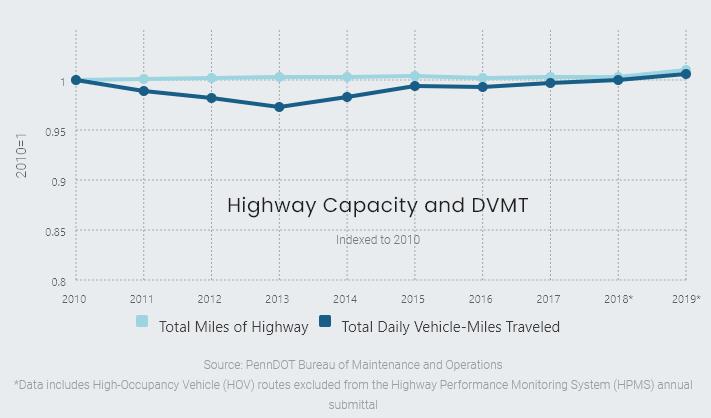
Highway capacity across Pennsylvania has remained relatively constant in recent years, while total daily vehicle miles traveled has increased by more than 8 million since 2013. Focus has shifted from large capacity-adding projects to preserving/maintaining the current highway system, optimizing the performance of the existing system, and managing travel demand.
PennDOT and its partners work to reduce travel delay through demand management (such as promoting public transportation use and flexible work schedules/telecommuting), and by accommodating more traffic on existing roadways through transportation system operations improvements (such as improved traffic signals or other technology).
Having a choice of well-connected, complementary transportation modes is a key facet of mobility for people and goods, as is the availability of real-time data to inform travel decisions.
Pandemic reverses Amtrak Keystone Corridor ridership gains
PennDOT has made major investments that have improved the corridor's travel time, facilities, and service expansions. Ridership on Amtrak's Keystone Corridor (Philadelphia-Harrisburg) had doubled since 2005, to a FY 2018-19 total of 1.5 million. Yet after years of steady growth, ridership demand declined by nearly 30 percent during FY 2019-20. Keystone services were suspended from March 18 through May 31, 2020 as a public safety measure during the COVID-19 pandemic.
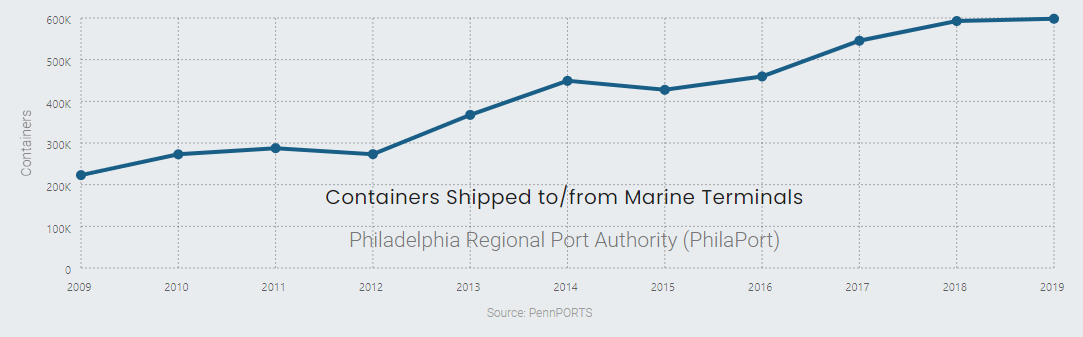
Pennsylvania’s ports are more vital than ever
Pennsylvania’s Intermodal Cargo Growth Incentive Program (PICGIP), originally slated to end in June 2020, was extended through 2022. The program incentivizes shippers to move cargo through Pennsylvania ports. The number of containers shipped to and from Philadelphia's marine terminals has more than doubled in less than a decade, bringing positive impacts for Pennsylvania jobs and economy.
Public transportation ridership plunged as the pandemic surged
Public transportation ridership in Pennsylvania has been decreasing moderately in recent years, yet it is still a major travel mode for many, as well as providing environmental and congestion management benefits. Public transit ridership plummeted during FY 2019-20 in response to the pandemic, and cash strapped transit agencies have been forced to cut service.
Information technology enhances travel
The number of users of Pennsylvania digital traveler and weather information has increased significantly, especially among those using the 511PA Mobile App.
Mobility Measures
Connected and Automated Vehicles
PennSTART Test Track 3D Visualization Source: PennSTART.org
Note: This video does not play audio.
- PennDOT has a critical role to play in helping to ensure that connected and automated vehicle technology is developed and tested safely.
- Since 2011, Pennsylvania has emerged as a leading destination for on-road testing of automated vehicles (AV). Based on the information provided by testers, testing is occurring in 56 of our 67 counties, with 42 percent of counties having two or more active testers. As of September 2020, there are nine authorized AV testers in Pennsylvania.
- PennSTART, a joint project between PennDOT, the Pennsylvania Turnpike Commission, and Penn State University, will include a test track for Connected and Automated Vehicle (CAV) technologies.
- In addition to managing the researching and testing of Highly Automated Vehicle (HAV) technology, PennDOT has also convened three PA Autonomous Vehicle Summits to explore the future potential of automated vehicles.
- PennDOT sponsored the development of the Pennsylvania Joint Statewide Connected and Automated Vehicles Strategic Plan.
Congestion
- Main sources of congestion were identified on Pennsylvania’s Core Roadway Network by correlating incident information from Waze and INRIX congestion data to a variety of PennDOT’s sources to determine a "cause".
- In 2019, one of the leading causes of congestion statewide was roadwork. Congestion causes, however, vary throughout each region of the state.
Highway Capacity
- Pennsylvania highway capacity overall has remained relatively stable with a slight increase in recent years, while total miles traveled has steadily increased since 2013.
- Current capacity-adding projects include I-95 South reconstruction in Philadelphia County, US 322 widening in Delaware County, I-70 reconstruction in Washington County, I-83 East Shore reconstruction in Dauphin County, and the Central Susquehanna Valley Transportation (CSVT) Project in Northumberland, Snyder, and Union counties.
- Adding highway capacity is expensive and sometimes only temporarily alleviates congestion. Strategies such as real-time traveler information, providing access to other modes and adaptive traffic signals can be more cost-effective in reducing congestion.
Traveler Information
- Use of PennDOT's traveler information platforms continues to grow.
- Pennsylvania travelers have a variety of information options with 511PA.com, strategically placed message boards with travel times, construction updates on key projects, and Twitter notifications.
- Users can also sign up for personalized alerts for their travel routes through 511PA.com.
- COVID-19 pandemic mitigation efforts drove down usage of the 511PA site as normal travel and commuting patterns were reduced.
Traffic Signals
Green Light-Go Program Funding
- There are approximately 14,000 signalized intersections in Pennsylvania. Most of these are owned and operated by the state’s municipalities.
- Traffic signal performance helps drivers and the public by improving travel efficiency and often reducing the cost of signal operation/maintenance over time.
- Act 89 of 2013 created the Green Light - Go program to provide funding for the management, operation, and maintenance of municipal traffic signals.
- COVID-19 and revenue shortfalls in the Motor License Fund disrupted funding to the Green Light-Go Program. Grant applications submitted in FY 2019-2020 (Year 6) were not awarded in 2020 but will be considered for the next round.
- PennDOT is conducting a pilot project that will transfer signal ownership of 50 signals along some of the I-76 parallel corridors in Montgomery County to PennDOT. The project will help address the following question: Will there be better mobility if PennDOT owns signals instead of the municipalities?
Traffic Incident Management
Traffic Map Legend
Source: PennDOT Bureau of Maintenance and Operations
- A traffic incident is defined as any non-recurring event that causes a reduction of roadway capacity or an abnormal increase in demand, such as traffic crashes, disabled vehicles, spilled cargo, or highway maintenance and reconstruction projects.
- There were 18,959 traffic incidents on Pennsylvania roadways in 2019, with an average clearance time of 95 minutes. Both the number of incidents and the average clearance time have risen each year.
- PennTIME, Pennsylvania's Statewide Traffic Management program, was formed in 2016 as recommended by the 2014 Transportation Advisory Committee Traffic Incident Management (TIM) study.
- PennTIME has developed an operational policy and organizational chart, conducted multiple training and public education programs, assisted in planning for PennSTART (a joint project between PennDOT, the Pennsylvania Turnpike Commission, and Penn State University), developed the framework of a PennTIME interagency agreement, and formed committees to foster growth and innovation in key TIM program areas.
- PennDOT has been updating Regional Operations Plans (ROPs) that identify existing Intelligent Transportation Systems (ITS) and operations infrastructure, needs, visions, and goals within each of four PA operations regions. Additionally, the Commonwealth is working to establish a statewide fiber network that will provide a fiber backbone for state uses. PennDOT plans to leverage this network for future ITS deployments.
Airport Enplanements
- The number of people boarding commercial aircraft in Pennsylvania has increased about 10 percent over recent years.
- Data for 2020 will not be available until September 2021, but enplanements are expected to show a sharp decrease due to continued impacts of the COVID-19 pandemic.
Public Transportation Ridership
- Fixed-route transit ridership includes trips on regular scheduled bus routes, commuter rail, and light rail. These ridership trends in Pennsylvania, as well as nationwide, have experienced a decline.
- Further declines in ridership are anticipated as Pennsylvania and the nation adapt to the economic and transportation impacts of the COVID-19 pandemic.
Amtrak Ridership
- Ridership in recent years on Amtrak’s Keystone Corridor has increased, on average, between 3 and 4 percent per year.
- Impacts of the COVID-19 Pandemic are reflected in FY 2019-2020 as the Keystone Corridor Service was suspended from March 18, 2020 to May 31, 2020.
- PennDOT is working with Norfolk Southern on a study for the expansion of passenger rail service from one to two daily trains between Pittsburgh and Harrisburg. The study will address the fees and potential capital requirements Norfolk Southern identifies for operating two trains along its tracks. Upgrades to the Mount Joy and Middletown train stations have also recently been completed.
- 2020 PA State Rail Plan
Freight Reliability
- The Truck Travel Time Reliability (TTTR) Index is a federal measure used to assess truck movement reliability on the Interstate system. More information on this measure can be found at the FHWA Transportation Performance Management Freight Fact Sheet.
- Higher TTTR Index values indicate worse reliability for truck travel.
- PennDOT has established a statewide target TTTR Index value of 1.40 by 2021.
- The TTTR values are impacted by regional traffic congestion, roadway construction, weather and accidents.
- PennDOT is updating its Statewide Freight Plan, which will address the state’s most pressing freight issues and concerns, including truck reliability. Adoption is anticipated summer 2021.
- 2016 PA Comprehensive Freight Movement Plan
Water Ports Freight Volume
- PennDOT established the Pennsylvania Intermodal Cargo Incentive Program to maintain and attract new containerized cargo to the Port of Philadelphia.
- The Pittsburgh Port Commission (PPC) is currently focusing on State of Good Repair and working closely with legislative bodies and the Army Corp of Engineers to ensure funding of the lock and dam projects to maintain 9-foot navigable waters and keep commerce moving on the inland waterways.
- Along with State of Good Repair projects the Port of Erie is planning lighted bike and pedestrian paths between the downtown area, waterfront hotels, conference centers, and its lighthouse.
- Funding grants to privately-owned terminals from Act 89’s Multimodal Transportation Fund exceed $8 million, while additional operating and capital funding for the three PA ports exceed $59 million. In total, all Act 89 funds committed and expended at private- and publicly-owned ports is approximately $67 million.
Winter Maintenance
- PennDOT has invested more than $4 million since 2015 to develop a Road Weather Information System (RWIS) network. These automatic weather stations measure real-time weather information, pavement conditions, water levels, and visibility.
- Implementing these types of technologies brings PennDOT to the national standard for DOT winter maintenance and improves levels of service during and following weather events.
- The Bureau of Maintenance and Operations has been working to identify areas where additional RWIS stations may be needed.
Winter Weather Traveler Info
- PennDOT began using Automated Vehicle Location (AVL) technology in 2014, allowing website users to track the locations of 119 plow trucks during the winter months. The program has now expanded to equip roughly 2,200 PennDOT-owned and rented plow trucks with AVL systems.
- PennDOT plans to equip more than 2,800 plow trucks with AVL for Winter 2020-21.
- Since its launch in December 2016, 511PAConnect, PennDOT and the Pennsylvania Turnpike Commission’s two-way emergency communication system, has been activated on 31 occasions to assist travelers trapped in queues during the winter months (November - March).
Weather Resiliency
- PennDOT completed an Extreme Weather Vulnerability Study in 2017 to assess risks and priorities, particularly related to the impacts of flooding on state-owned roads and bridges.
- A pilot study, completed in September 2020, assessed the impacts of projected flood levels on the design of roads, bridges, and culverts in areas of Allegheny and Delaware counties, and will be used to determine statewide applicability. This could help ensure that future flooding estimates are better considered as part of transportation improvements.
Safety Service Patrol
- The Safety Service Patrol offers free assistance to motorists on major highways around Pittsburgh, Philadelphia, Harrisburg, the Lehigh Valley, and most recently Reading to clear incidents quickly and reduce congestion.
- PennDOT's Roadside Assistance Page
PRESERVATION
Maintaining Transportation Assets
Pennsylvania's vast network of roadways and bridges requires effective resource management to improve and maintain the system.
State-owned bridge condition reaches milestone
The number of state-owned bridges rated "poor" is now less than 2,600, reflecting a concentrated effort to reduce the backlog of bridges needing repairs. PennDOT launched the $889 million Rapid Bridge Replacement Project in 2015 to improve many of the bridges in poor condition.
Local bridge condition trends positively
Conditions of locally-owned bridges over 20 feet long are also improving, but due to the sheer number and age of local bridges needing improvement, this continues to be a major challenge for communities.
Programming philosophy changes
Poor bridge populations have been greatly reduced; however, there is inadequate funding to continue this method of prioritization. Transitioning away from “worst-first” to "lowest life cycle cost”-based project selection will help keep good bridges from becoming poor and yield additional years of service from existing poor structures.
Preservation Measures
State Bridges
- Through investing more in our infrastructure with both traditional and non-traditional means, such as Public-Private Partnerships (P3’s), PennDOT has greatly reduced our poor bridge population. However, there is inadequate funding to continue this method of prioritization.
- PennDOT continues to transition from poor-first and into a Lowest Life Cycle Cost (LLCC) based project selection/prioritization process to keep good bridges from becoming poor and yield additional years of service from existing poor structures.
- PennDOT Bridges
Local Bridges
- Local bridges are improving, with the number rated "poor" now under 2,000. However, extensive investment is required to bring local bridges into a state of good repair.
- PennDOT has entered into agreement with some municipalities to manage local bridge bundle packages handling consultant selection, design, construction, and inspection. This has contributed to improving the state’s local bridge inventory.
- Act 89 of 2013 established a special fund allowing counties to implement a $5 fee on vehicle registrations. Twenty-four counties participate and have used funding to improve bridges.
- Fee for Local Use
- The STC approved the findings and recommendations of a Local Small Bridges Study report in 2021. The study included recommendations to help create increased capacity and incentives to facilitate uniformity in local small bridge (i.e., less than 20 feet in length) asset management.
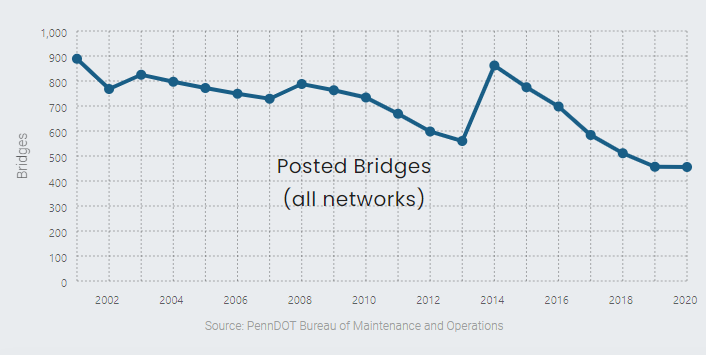
Weight-Restricted Bridges
- Pennsylvania has made significant progress in bridge construction to reduce the number of weight-restricted bridges.
- The 2014 spike reflects the adoption of a more stringent rating standard. However, subsequent implementation of initiatives such as the Rapid Bridge Replacement Project have successfully reduced the number of weight restricted bridges.
Pavement Condition by Roadway Type
- Pavement conditions, on average, have been slowly improving over the past several years.
- PennDOT has maintained the state’s percentage of poor International Roughness Index (IRI) (a measure of pavement condition) through Lowest Life Cycle Cost approaches.
- PennDOT's Transportation Asset Management Plan provides data-driven approaches to help select the most cost-effective improvements.
- Typically when projecting future conditions, past changes in performance and planned work are considered. For future years, it will be increasingly more difficult to predict changes as the COVID-19 pandemic impacts Pennsylvania’s transportation network. PennDOT is expecting an increase in poor IRI but the severity is unknown.
- 2019 Transportation Asset Management Plan
Rapid Bridge Replacement

- PennDOT launched the $889 million Rapid Bridge Replacement (RBR) Project in 2015 to reduce the state's backlog of bridges in poor condition.
- The initiative replaced 558 bridges that have been constructed through this public-private partnership (P3) approach and are open to traffic.
- These new bridges should not require significant maintenance during the first 25-35 years of service, but the RBR program includes a warranty maintenance term to ensure that the bridges are constructed to achieve the lowest lifecycle cost of ownership.
- P3 Rapid Bridge Replacement Map
ACCOUNTABILITY
Managing Resources & Business Processes
For transportation agencies, accountability means making the most of every dollar available to provide a safe, efficient, and accessible transportation system. Modernizing technologies, materials, and practices; forming beneficial partnerships; tracking performance; and collaborating with communities are some of the ways Pennsylvania continues to enhance resource management and efficiency with greater impacts.
The COVID-19 pandemic has brought with it an increasing number of Department employees working from home. At the end of 2020, approximately one third of the Department’s workforce was teleworking.
Accountability Measures
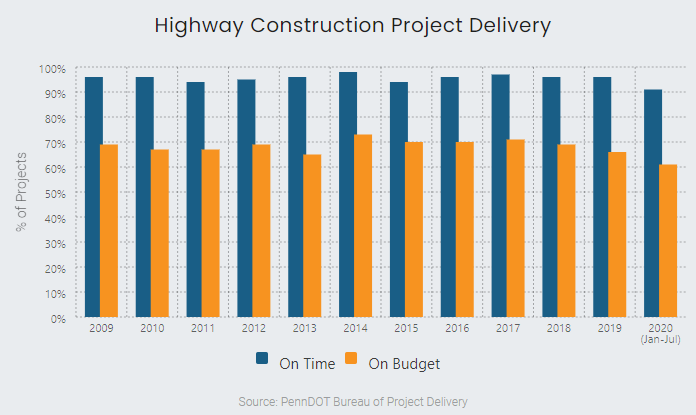
Project Delivery
- On-time and on-budget performance has been steady for PennDOT's highway construction contracts.
- For over a decade, more than 90 percent of highway construction projects have been completed on time each year. In mid-March 2020, all construction projects were temporarily suspended due to COVID-19, which may have an effect on highway construction delivery performance.
- The ability to deliver as many projects as possible on time and within budget helps Pennsylvania transportation and stretches limited resources.
Transit Performance
Farebox Recovery Rate Comparison
- Pennsylvania's farebox recovery rate is strong - the seventh-best in the nation.
- PennDOT has emphasized transit operator performance, efficiency, and accountability.
- Strong farebox recovery at the local transit system level often reflects community support of public transit and sound management.
Transit Modernization
Source: PennDOT Bureau of Public Transportation
- Act 44 of 2007 established a framework for PennDOT to conduct Transit Agency Performance Reviews.
- The reviews assess the efficiency and effectiveness of service, financial stability, and general management.
- PennDOT reviews each transit agency once every five years, helping provide reasonable assurance that transit agencies are effectively managing resources and acting upon opportunities for improved operations.
- Pennsylvania Public Transportation Performance Report
Driver and Vehicle Services
- Public feedback from interaction with PennDOT's Driver and Vehicle Services (DVS) personnel remains highly favorable. Driver and Vehicle Services is also seeking to further enhance the customer’s experience by ensuring each interaction with the department is positive and exceeds their expectations.
- DVS’s vision is to modernize by creating a paperless, streamlined, and mobile-based workforce, resulting in a proactive approach to doing business with customers, legislature, and stakeholders.
- DVS allows for online vehicle registration renewals. In the past four years, nearly half of all customers renewed their registration online.
- DVS has saved more than $11.7 million since eliminating sticker registration in 2017.
- DVS is currently evaluating options to implement a Mobile Driver License/ID solution. It has also launched a pilot project to examine the usability of digital license plates.
PennDOT Connects
- PennDOT Connects engages community stakeholders, planning organizations, and local governments to help ensure that community needs are understood at each phase of a transportation project's planning process. The program aims to improve communities and mobility by building partnerships, leveraging resources, and deliver projects that improve economic competitiveness, access to work, and overall quality of life.
- Since 2017, PennDOT has invested nearly $3.2 million in 26 planning studies using PennDOT Connects funding sources. The studies collectively involved 18 planning regions and 9 PennDOT districts, with 20 studies addressing local issues and 6 addressing regionwide policy and planning concerns.
- The completion and progress of the studies resulted in a range of impacts such as informing specific future investments on the state system, provide municipal next steps, development of new data and new tools, advancement of new technology applications, and demonstrated enhanced partnerships as a result of the planning effort.
- PennDOT Connects Website
- PennDOT Connects Implementation (2018)
FUNDING
Investing for the Future
The emergence of the COVID-19 pandemic in early 2020 affected more than just public health. Wholesale changes in how Pennsylvanians go to work, or shop have had an enormous effect on transportation revenues. The decrease in the demand for travel significantly reduced the department’s gas tax and other revenues. Losses are estimated to be between $500 and $600 million, and have resulted in program reductions in highway construction, highway maintenance, and other critical programs.
Federal Funding
The federal Fixing America's Surface Transportation (FAST) Act, which was originally slated to expire in September 2020, was extended for one year, with funding continuing at current levels. The federal gas tax has not been increased since 1993 and remains inadequate to fully fund the Highway Trust Fund (HTF), which supports federal highway, bridge and transit spending. The long-term solvency of the HTF and the ability of federal funds to support Pennsylvania’s infrastructure remain uncertain.
Legislated Changes to Act 44/89 Funding
Act 44 of 2007 mandated annual payments by the Pennsylvania Turnpike Commission (PTC) to PennDOT through the Public Transportation Trust Fund. In FY 2022 the PTC $450 million annual payment will drop to $50 million through 2057. The deficit is slated to be backfilled by vehicle sales tax revenue, transferred from the state’s general fund.
Interstate Programming
The Department has begun a greater programming focus on Pennsylvania’s interstates. These roadways account for 6 percent of the state’s total roadway capacity yet accommodate 24 percent of all travel. Investment in interstates will continue to ramp up each year before reaching $1 billion annually by FY 2028. This shifts funding away from the remainder of the system.
PennDOT’s Pathway Program
PennDOT is launching an extensive initiative to examine near- and long-term funding solutions – and how they could work in Pennsylvania. As part of this program, PennDOT recently launched an alternative funding Planning and Environmental Linkages (PEL) Study to explore options for funding the maintenance and improvement of the state’s highways and bridges.
Funding
State Transportation Budget
- Payments from the Motor License Fund to the Pennsylvania State Police, which previously increased annually and led to a corresponding decrease in Highway and Bridge funding, were capped by the FY 2016-17 Fiscal Code. Payments are to be gradually reduced until reaching a $500 million floor by FY 2027-28.
- Beginning in FY 2018-19, Driver & Vehicle Services will see its budget needs increased by an average of $30 million annually over the projection period due to the implementation of Real ID requirements (Act 3 of 2017, Pennsylvania Real ID Compliance Act).
- Real ID requirements are expected to cost PennDOT's Bureau of Driver and Vehicle Services a total of $150 million through FY 2023-24.
- COVID has had a major impact on the Motor License Fund. From March 2020 through December 2020, revenues are $450 million less than the previous time period. As a result, major spending reductions were needed in Maintenance Operations, Construction Lettings as well as future Payments to Municipalities. These reductions will continue well into Calendar Year 2021 as total COVID losses are expected to be between $500 and $600 million.
12-Year Program
- Pennsylvania's 12-Year Program (TYP) identifies and prioritizes transportation improvement projects for the various modes.
- There are several potential funding risks associated with implementing the 2021 TYP. The end of the most recent federal legislation, Fixing America’s Surface Transportation (FAST) Act in September 2020, the potential bankruptcy of the Federal Highway Trust Fund (HTF), and the effects of the COVID-19 pandemic will jeopardize highway, bridge, and transit projects. The Transportation Advisory Committee has proactively evaluated many of these risks and their impacts.
- 2021 12-Year Program
- Risks to Transportation Funding in Pennsylvania
State Motor License Fund
- Motor fuels taxes and other fees are dedicated to Pennsylvania's Motor License Fund - the primary state source of transportation funding.
- The Motor License Fund provides funding for highway and bridge maintenance and improvements, winter services, and payments to the Commonwealth's many communities for local road and bridge improvements.
- Pennsylvania, like other states, will have to consider a wider range of funding strategies in light of greater fuel efficiency, alternative fuel vehicles, and other threats to MLF revenue. In addition, the COVID-19 pandemic and the change in commuting behavior have impacted, and will continue to impact, revenue for the Motor License Fund.
Multimodal Transportation Fund
- The Multimodal Transportation Fund (MTF), established through Act 89 of 2013, provides funding for projects that improve all transportation modes. Revenue and expenditure amounts are generally fixed by law, and thus are expected to remain stable.
- These grants have contributed substantially to community quality of life at relatively low cost.
- Since program inception in FY 2014-15, PennDOT has awarded grants to 252 projects, totaling $261.1 million through FY 2020-21.
- PennDOT Safe Routes to School (SRTS), Transportation Alternatives Program (TAP), and Multimodal Transportation Fund Statewide Program (MTF) Projects Map
- 2020-2021 PennDOT MTF Awards
Public Transit Operating Assistance
- Pennsylvania is viewed as a leader among the states for its support of public transportation, including funding and technical assistance.
- In response to the COVID-19 pandemic, the Coronavirus Aid, Relief, and Economic Security (CARES) Act was signed into law, providing Pennsylvania $1.1 billion in funding for public transportation.
- PennDOT is evaluating risks and potential solutions associated with the impacts of the COVID-19 pandemic. As ridership is reduced and teleworking grows, public transportation is transforming long term therefore making planning efforts increasingly urgent.
Interstate Funding
Miles of Interstate Reconstructed
Actual Funded Annually vs. Annual Need
- Many of Pennsylvania's Interstate Highways are aging and require reconstruction. On average, it costs $2.6 million per mile to reconstruct one lane of interstate pavement.
- Insufficient funding for the interstates has created a backlog of need for reconstruction projects. Every year 68 miles of interstate should be reconstructed and currently (on average) only 12 miles are being completed annually.
- In an effort to accomplish more miles of needed reconstruction, more funds are being directed to the interstate system and away from other needed National Highway System projects.
Rail Freight Infrastructure Funding
- Pennsylvania’s freight rail system is composed of more than 5,600 miles of track operated by 65 railroads, making the state first in the country in the number of operating railroads and fourth in total railroad mileage. PennDOT is making major efforts to support economic competitiveness, smart growth, and resiliency to deliver the greatest value for Pennsylvania’s shippers and receivers. In January 2021, the STC approved the release of $31.3 million for 26 freight improvement projects through the Rail Transportation Assistance Program (RTAP) and Rail Freight Assistance Program (RFAP). This grant funding will enhance freight mobility while creating or sustaining more than 200 jobs across Pennsylvania.
- Pennsylvania's overall funding for rail freight improvements has been increasing over the past two decades.
Transit Capital Funding
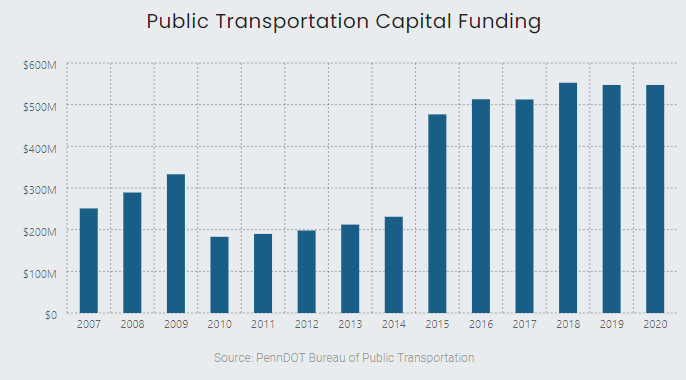
Public Private Partnerships (P3)
Since Act 88 of 2012 authorized PennDOT to enter into Public-Private Partnership (P3) agreements, PennDOT has launched several strategic projects.
A P3 involves a public entity such as PennDOT transferring responsibility (with proper oversight) for the design, financing, construction, operation, and maintenance of a project to a private-sector entity for a defined period of time. The private entity, in exchange, has the opportunity to generate revenue from the project. The following highlights a few projects from the last two years.
Major Bridges Program
- Also, in 2020, the P3 Transportation Board launched the Major Bridge P3 program. This initiative is a component of PennDOT’s forthcoming Pathways initiative, part of the department’s ongoing work to explore sustainable transportation funding options in response to a growing highway and bridge funding gap. Seventy-four percent of highway and bridge funding is generated through gas taxes, but fuel consumption has been progressively decreasing. The initiative will aim to provide travelers, residents, and businesses with high-quality transportation infrastructure by studying and implementing alternative funding solutions that could address near- and long-term highway and bridge needs.
Partnership 81
- In 2020, the P3 Transportation Board approved PennDOT's Partnership 81 project. The project is designed to replace over 7.5 miles of aging interstate and poor condition bridges in Luzerne County.
Compressed Natural Gas (CNG) Fueling Stations for Transit Agencies
- In 2016, PennDOT announced its partnership with Trillium CNG to design, build, finance, operate, and maintain 29 CNG fueling stations at public transit agency sites through a 20-year P3 agreement. The first CNG Station opened in April 2017 in Johnstown. As of October 2020, 19 CNG fueling stations have been constructed.
Sources and Acknowledgements
Sources
This report draws on data collected and analyzed by various units of PennDOT and our federal and state partner agencies.
PennDOT
- Asset Management Division
- Bureau of Aviation
- Bureau of Fiscal Management
- Bureau of Innovations
- Bureau of Maintenance and Operations
- Bureau of Planning and Research
- Bureau of Project Delivery
- Bureau of Public Transportation
- Bureau of Rail Freight
- Center for Program Development and Management
- Driver and Vehicle Services
- Pennsylvania Transportation Public Private Partnerships Office
- Transportation Advisory Committee
- 2018 State of Highway Safety Summary Report
- 2021 12-Year Program
- Bridge Management System
- PennPORTS
USDOT
- Federal Aviation Administration
- Federal Highway Administration
- Office of Freight Management and Administration, Freight Analysis Framework Version 4 (FAF4)
- Federal Transit Administration
- National Transit Database
- National Highway Traffic Safety Administration
Other
- PennSTART
- Texas A&M Transportation Institute, 2017 Annual Urban Mobility Scorecard
- Centers for Disease Control and Prevention
© 2021 Pennsylvania Transportation Performance Report
Developed by Michael Baker International - February 2021
Developed by Michael Baker International - February 2021